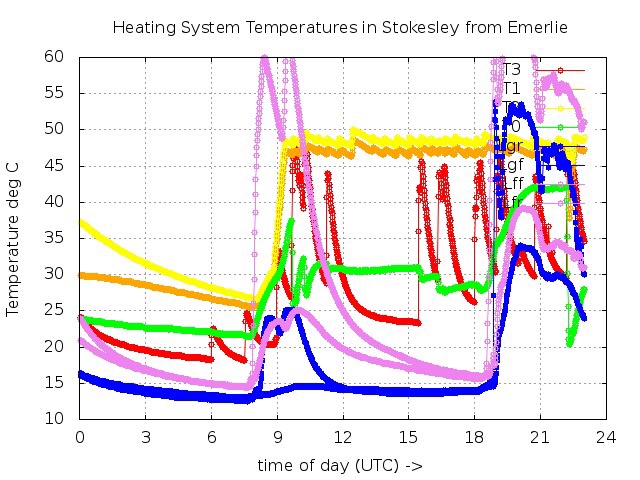
The result is a graph of the temperatures in the house, emailed twice a day.

Room Temperatures
These are requested from the crontab schedule:
00 00 * * * /home/pi/house/Send_graphs
33 12 * * * /home/pi/house/Send_graphs
02 00 * * * cat house/Temps.txt >> house/cumlat.txt
03 00 * * * rm house/Temps.txt
* * * * * date >> /home/pi/house/Temps.txt
* * * * * python3 /home/pi/house/Read_temps.py3 >> /home/pi/house/Temps.txt
This executes the Send_graphs script below at midnight and 12:33
Send_graphs:
#!/bin/bash
cd /home/pi/house
python Email_graphs.py
Where the python script Email_graphs.py is :
#! /usr/bin/python
# Python script to email the graph of temperature data#Config data for the smtp server.
SMTPserver = ‘xxx.com’
USERNAME = “xxxx”
PASSWORD = “xxxx”
destination = [‘phil.barber2@gmail.com’]
sender = ‘<Emerlie@xxxx.com>’
text_subtype = ‘plain’
content=”See Attached File”
# Import some libraries
import sys
import os
import re
import time
from smtplib import SMTP_SSL as SMTP # this invokes the secure SMTP protocol (port 465, uses SSL)
from email.MIMEMultipart import MIMEMultipart
from email.MIMEBase import MIMEBase
from email.MIMEText import MIMEText
from email import Encoders
from subprocess import call# Proces the data so that Gnuplot can develop a graph
# the data has been stored in Temps.txt that is cleared out once per day.output_file = open(“Temps.dat”,’w’);
input_file = open(“Temps.txt”,’r’);
lasttime = 0.0
Aline = input_file.readline()
while Aline :
# ( An empty string is considered false.)
if (Aline.find(“UTC”)>0) :
lasttime = time.mktime(time.strptime(Aline[0:28],”%a %d %b %H:%M:%S UTC %Y”))
output_file.write(‘\n’)
output_file.write(time.strftime(“%H, %M , “,time.gmtime(lasttime)))
else :
End_of_line = Aline.find(‘\n’)
output_file.write(Aline[10:End_of_line])
output_file.write(” , “)
Aline = input_file.readline()
input_file.close()
output_file.close()# Use a gnuplot script to generate the graphs
call([“gnuplot”,”R1_graph.gnu”])# Email the graph
msg = MIMEMultipart()
msg[‘From’] = sender
msg[‘Date’] = time.strftime(“%a, %d %b %Y %H:%M:%S %z”)
msg[‘To’] = ‘, ‘.join(destination)
msg.attach(MIMEText(content))try:
attachment_file = ‘/home/pi/house/Temps_1.jpg’
attach_file_handler = open(attachment_file,’rb’)attach_part = MIMEBase(‘application’,’octet-stream’)
attach_part.set_payload(attach_file_handler.read())
Encoders.encode_base64(attach_part)
attach_part.add_header(‘Content-Disposition’, ‘attachment; filename=”%s”‘ % attachment_file.split(‘/’)[-1])
msg.attach(attach_part)conn = SMTP(SMTPserver,465)
conn.ehlo()
conn.login(USERNAME, PASSWORD)
conn.ehlo()
conn.sendmail(sender, destination, msg.as_string())
conn.close()except Exception, exc:
sys.exit( “mail failed; %s” % str(exc) ) # give a error message
This needs an SMTP server set up, and processes temperature data from a text file into a csv file, that Gnuplot reads to generate a jpg.
The csv file is of the form:
13, 48 , 25, 23.0, 45.1, 13.9 , 99, 15.8, 7.9, 12.8 ,
13, 49 , 25, 23.0, 44.9, 13.9 , 99, 15.8, 8.0, 12.8 ,
13, 50 , 25, 22.9, 44.8, 13.9 , 99, 15.8, 7.9, 12.8 ,
13, 51 , 25, 22.8, 44.7, 13.9 , 99, 15.8, 7.9, 12.8 ,
13, 52 , 25, 22.8, 44.6, 13.8 , 99, 15.8, 7.9, 12.8 ,
13, 53 , 25, 22.8, 44.8, 13.8 , 99, 15.8, 7.9, 12.8 ,
13, 54 , 25, 22.8, 44.7, 13.8 , 99, 15.8, 7.9, 12.8 ,
13, 55 , 25, 22.7, 44.6, 13.8 , 99, 15.8, 7.9, 12.7 ,
13, 56 , 25, 22.7, 44.5, 13.9 , 99, 15.8, 7.9, 12.7 ,
13, 57 , 25, 22.6, 44.5, 13.8 , 99, 15.8, 7.9, 12.7 ,
13, 58 , 25, 22.6, 44.3, 13.8 , 99, 15.8, 7.9, 12.7 ,
13, 59 , 25, 22.6, 44.0, 13.8 , 99, 15.8, 7.9, 12.7 ,
14, 00 , 25, 22.6, 43.8, 13.8 , 99, 15.8, 7.9, 12.7 ,
14, 01 , 25, 22.5, 43.6, 13.8 , 99, 15.8, 7.9, 12.6 ,
14, 02 , 25, 22.4, 43.6, 13.8 , 99, 15.8, 7.9, 12.6 ,
This is in the form of hh,mm, IP, T1, .. Tn, IP, T1, … Tn, where the last byte of the IP is recorded for each outstation.
This csv is used by the following gnuplot script R1_graph.gnu to generate the jpg.
set datafile separator “,”
set term jpeg
set output “Temps_1.jpg”
set title “Room Temperatures in Stokesley from Emerlie”
set xlabel “time of day (UTC) ->”
set ylabel “Temperature deg C”
set xrange [0 : 24]
set yrange [0 : 25]
set grid
set xtics 3
set ytics 5plot \
“Temps.dat” using ($1*60+$2)/60:4 ls 19 lc rgb “green” with linespoints title ‘L1’ , \
“Temps.dat” using ($1*60+$2)/60:6 ls 7 with linespoints title ‘H1’ , \
“Temps.dat” using ($1*60+$2)/60:7 ls 19 with linespoints title ‘H2’ , \
“Temps.dat” using ($1*60+$2)/60:8 ls 13 with linespoints title ‘H3’
The CSV file is generated from an original txt file which is of the form:
Sat 3 Dec 00:10:01 UTC 2016
192.168.1.20, 14.6
Local : 99, 13.1, 6.9, 10.7
Sat 3 Dec 00:11:01 UTC 2016
192.168.1.20, 14.6
Local : 99, 13.1, 6.9, 10.7
Sat 3 Dec 00:12:01 UTC 2016
192.168.1.20, 14.6
Local : 99, 13.1, 6.9, 10.7
Sat 3 Dec 00:13:01 UTC 2016
192.168.1.20, 14.6
Local : 99, 13.1, 6.9, 10.7
Sat 3 Dec 00:14:01 UTC 2016
192.168.1.20, 14.6
Local : 99, 13.1, 6.9, 10.8
Sat 3 Dec 00:15:01 UTC 2016
192.168.1.20, 14.6
Which is generated by piping the result of a python(3) script to read all the temperatures from the outstations to a cumulative file. This is executed every minute, from the crontab scheduler.
Read_temps.py3
import sys
import urllib.request
Tstart=0;
res = “mary had a little lamb”def Read_remote_at(Meters_IP_Address):
” Read meter HTTP”
u_m = ‘http://’ + Meters_IP_Address
f=urllib.request.urlopen(u_m)
res = str(f.read())
f.close();
Tstart=res.find(“Temperature”)
if (Tstart >0):
print(u_m[7:],end=””)
while (Tstart > 0):
print(“,” + res[Tstart+16:Tstart+21],end=””)
res = res[Tstart+10:]
Tstart=res.find(“Temperature”)
print()
returndef Read_local(devicename):
try :
filename =’/sys/bus/w1/devices/’ + devicename + ‘/w1_slave’
f = open(filename, ‘r’)
line = f.readline() # read 1st line
crc = line.rsplit(‘ ‘,1)
crc = crc[1].replace(‘\n’, ”)
if crc==’YES’:
line = f.readline() # read 2nd line
mytemp = line.rsplit(‘t=’,1)
else:
mytemp = 99998
f.close()
return (int(mytemp[1])/float(1000) )
except:
return 99999if __name__ == ‘__main__’:
# Script has been called directly
Read_remote_at(‘192.168.1.20′)T1 = ’28-031660d695ff’
T2 = ’28-0316837908ff’
T3 = ’28-05168435eaff’print (‘Local : 99, ‘ + \
‘{:4.1f}’.format(Read_local(T1)) + \
‘, {:4.1f}’.format(Read_local(T2)) + \
‘, {:4.1f}’.format(Read_local(T3)) \
)
Finally, crontab schedules a daily cleanup of the txt file, but before this, it concatenates it to a long term store.

Not entirely reliable. Emailing section replaced with a hourly update of the jpgs onto a server on Cambridge, from where a more reliable email connection can be established.
LikeLike